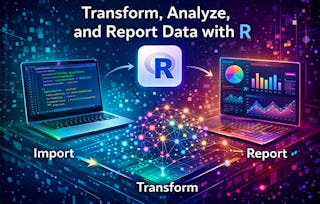
Coursera

Market Research Data Analysis and Governance with R

通过 Coursera Plus 提高技能,仅需 239 美元/年(原价 399 美元)。立即节省

Coursera

Market Research Data Analysis and Governance with R

包含在 Coursera Plus

深入了解一个主题并学习基础知识。
初级 等级

推荐体验

2 周 完成
在 10 小时 一周
灵活的计划
自行安排学习进度
深入了解一个主题并学习基础知识。
初级 等级

推荐体验

2 周 完成
在 10 小时 一周
灵活的计划
自行安排学习进度

您将学到什么

  • Apply R programming techniques for comprehensive data analysis and create automated, parameterized reports with R Markdown to minimize manual error.

  • Implement robust data governance and quality monitoring practices to ensure data integrity and auditability.

  • Evaluate and validate predictive models using advanced diagnostic techniques to improve accuracy and reliability.

  • Master data provenance to ensure findings are defensible and communicate insights effectively to stakeholders.

要了解的详细信息

可分享的证书

添加到您的领英档案

最近已更新!

April 2026

授课语言:英语(English)

了解顶级公司的员工如何掌握热门技能

Petrobras, TATA, Danone, Capgemini, P&G 和 L'Oreal 的徽标

积累 Data Analysis 领域的专业知识

本课程是 Market Research Analyst: AI, Power BI, SurveyMonkey skilled 专业证书 专项课程的一部分
在注册此课程时,您还会同时注册此专业证书。
  • 向行业专家学习新概念
  • 获得对主题或工具的基础理解
  • 通过实践项目培养工作相关技能
  • 通过 Coursera 获得可共享的职业证书

该课程共有9个模块

The Summarize and Evaluate Ethical AI Insights innovative module develops cutting-edge skills in AI-assisted qualitative analysis and ethical data practices. You will master techniques for using large language models to summarize qualitative data and critically evaluate the ethical implications of synthetic data. Through hands-on application, you will build advanced capabilities that combine AI tools with ethical considerations to enhance research insights.

涵盖的内容

4个视频3篇阅读材料4个作业

Organize Research Data: File Management module provides a professional foundation for bringing order to digital chaos. You will navigate the essential stages of data processing—from raw collection to final analysis—while mastering standardized naming conventions and file structures. Through hands-on labs and real-world case studies, you'll develop the governance skills necessary to prevent costly errors and ensure long-term data integrity. By implementing these systematic approaches, you will transform disorganized files into accessible, high-value knowledge repositories. This experience empowers you to maintain reliable research systems that support accurate, data-driven decision-making.

涵盖的内容

4个视频4篇阅读材料5个作业

Govern and Evaluate Research Data Quality module builds data governance and quality management capabilities for research professionals. You will develop skills in applying metadata tagging for effective data governance and evaluating data quality against defined standards. Through practical application, you will build the technical capabilities needed to implement robust data management practices that ensure information integrity and accessibility.

涵盖的内容

4个视频3篇阅读材料3个作业

R: Code, Import, Transform Data is your professional entry point into the world of data analysis. Designed for aspiring analysts, this module teaches you to write R scripts that take full control of your datasets. You will progress from understanding core syntax—variables, vectors, and data frames—to importing CSVs and performing essential cleaning tasks. Through hands-on labs, you will master selecting data and renaming columns for maximum clarity. By the end, you'll have built a functional script that prepares raw data for analysis, a fundamental skill used by organizations like the BBC. This experience provides the critical building blocks for a successful data-driven career.

涵盖的内容

4个视频2篇阅读材料3个作业

Transform, Analyze, and Report Data with R is your gateway to robust, scalable analysis. Designed for aspiring analysts, this module teaches you to build sophisticated end-to-end projects using the "Tidyverse" approach. You'll master dplyr to create clean, pipe-based workflows for filtering and merging complex data. You will also master automation—the hallmark of modern analysis—using R Markdown to generate dynamic reports. Finally, you'll evaluate predictive models using diagnostic tools like ROC curves. By the end, you'll have a portfolio-ready project and the skills to build efficient, reproducible workflows. No prior R experience is necessary.

涵盖的内容

6个视频3篇阅读材料6个作业

Excel for Data Analysis is a beginner-friendly guide to transforming raw numbers into compelling business stories. You will move beyond basic data entry to master essential statistical functions like AVERAGE, STDEV, and COUNTIF, enabling you to summarize complex datasets and uncover key metrics. Beyond calculations, you’ll learn the art of visual storytelling using conditional formatting to highlight trends and outliers. Through real-world scenarios—from sales tracking to NPS analysis—you will develop the skills to answer critical business questions. This experience culminates in a hands-on project, building a summary report that turns data into actionable insights.

涵盖的内容

6个视频3篇阅读材料4个作业

Statistical Tests for Market Research builds essential capabilities for extracting defensible insights from raw data. You will develop a strong understanding of statistical functionality while mastering hypothesis testing to compare group differences. This module moves beyond simply running tests to explaining why they matter for business strategy. Through hands-on applications like A/B testing and customer satisfaction analysis, you will master the two-sample t-test in Excel. You'll learn to interpret critical metrics like the p-value and translate them into actionable recommendations. These foundational skills empower you to use statistical evidence to validate assumptions and drive data-driven decision-making.

涵盖的内容

3个视频2篇阅读材料5个作业

Predict and Validate Regression Models in R is your professional entry point into the world of multiple linear regression. Designed for aspiring analysts, this module empowers you to build and interpret predictive models from the ground up. You will move beyond simply running code to critically evaluating performance through hands-on labs and real-world case studies. You will master diagnosing statistical assumptions using residual plots and assessing model reliability with k-fold cross-validation. By the end, you will build trustworthy models and generate dependable forecasts. This experience culminates in a validated, portfolio-ready project that supports strategic business decisions with confidence.

涵盖的内容

4个视频4篇阅读材料4个作业

Data Pipeline and Model Validation Lab is where you build a professional, reproducible R workflow. You will integrate data from multiple sources—CSVs, Excel, and JSON—while applying governance standards through automated metadata tagging and standardized cleaning. Using the tidyverse and dplyr, you'll develop pipe-based scripts to merge complex datasets and create parameterized R Markdown reports. The module culminates in building a multiple linear regression model, validated through 5-fold cross-validation and diagnostic plots. By the end, you will have a project demonstrating the technical and governance skills required for senior analytical roles.

涵盖的内容

2篇阅读材料1个作业

获得职业证书

将此证书添加到您的 LinkedIn 个人资料、简历或履历中。在社交媒体和绩效考核中分享。

位教师

Professionals from the Industry
362 门课程50,614 名学生

提供方

Coursera

人们为什么选择 Coursera 来帮助自己实现职业发展

Felipe M.

自 2018开始学习的学生
''能够按照自己的速度和节奏学习课程是一次很棒的经历。只要符合自己的时间表和心情,我就可以学习。'

Jennifer J.

自 2020开始学习的学生
''我直接将从课程中学到的概念和技能应用到一个令人兴奋的新工作项目中。'

Larry W.

自 2021开始学习的学生
''如果我的大学不提供我需要的主题课程,Coursera 便是最好的去处之一。'

Chaitanya A.

''学习不仅仅是在工作中做的更好:它远不止于此。Coursera 让我无限制地学习。'
Coursera Plus

通过 Coursera Plus 开启新生涯

无限制访问 10,000+ 世界一流的课程、实践项目和就业就绪证书课程 - 所有这些都包含在您的订阅中

通过在线学位推动您的职业生涯

获取世界一流大学的学位 - 100% 在线

加入超过 3400 家选择 Coursera for Business 的全球公司

提升员工的技能,使其在数字经济中脱颖而出

常见问题

¹ 本课程的部分作业采用 AI 评分。对于这些作业,将根据 Coursera 隐私声明使用您的数据。