This comprehensive online course will empower you with advanced statistical techniques to derive data summaries and visualisations for you to drive actionable insights, using Microsoft Excel.

Statistics and Data Analysis with Excel: Advanced
通过 Coursera Plus 提高技能,仅需 239 美元/年(原价 399 美元)。立即节省

Statistics and Data Analysis with Excel: Advanced
4,638 人已注册
包含在 中
您将学到什么
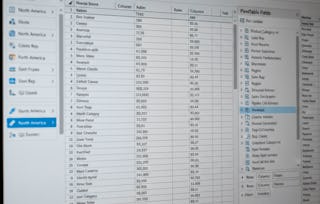
Design and develop interactive data visualisations in Excel.
Integrate Excel functions and the Data Analysis ToolPak for professional applications.
Analyse and evaluate data in Excel using advanced statistical tools.
Create forecasts in Excel to drive actionable insights.
您将获得的技能
- Statistical Analysis
- Forecasting
- Statistical Methods
- Statistical Modeling
- Data Analysis
- Statistics
- Spreadsheet Software
- Regression Analysis
- Variance Analysis
- Data-Driven Decision-Making
- Time Series Analysis and Forecasting
- Data Literacy
- Data Visualization
- Excel Formulas
- Statistical Inference
- Statistical Hypothesis Testing
- Analytics
- Data Analysis Software
- Probability & Statistics
您将学习的工具
要了解的详细信息

可分享的证书
添加到您的领英档案
作业
9 项作业
授课语言:英语(English)
了解顶级公司的员工如何掌握热门技能

积累特定领域的专业知识
本课程是 Statistics and Data Analysis with Excel 专项课程 专项课程的一部分
在注册此课程时,您还会同时注册此专项课程。
- 向行业专家学习新概念
- 获得对主题或工具的基础理解
- 通过实践项目培养工作相关技能
- 获得可共享的职业证书

该课程共有5个模块
获得职业证书
将此证书添加到您的 LinkedIn 个人资料、简历或履历中。在社交媒体和绩效考核中分享。
位教师

28 门课程1,655,289 名学生


从 Data Analysis 浏览更多内容
 状态:免费试用
 状态:免费试用
Macquarie University
 状态:免费试用
 状态:免费试用
Logical Operations
人们为什么选择 Coursera 来帮助自己实现职业发展

Felipe M.
自 2018开始学习的学生
''能够按照自己的速度和节奏学习课程是一次很棒的经历。只要符合自己的时间表和心情,我就可以学习。'

Jennifer J.
自 2020开始学习的学生
''我直接将从课程中学到的概念和技能应用到一个令人兴奋的新工作项目中。'

Larry W.
自 2021开始学习的学生
''如果我的大学不提供我需要的主题课程,Coursera 便是最好的去处之一。'

Chaitanya A.
''学习不仅仅是在工作中做的更好:它远不止于此。Coursera 让我无限制地学习。'
学生评论
- 5 stars
88.23%
- 4 stars
5.88%
- 3 stars
0%
- 2 stars
0%
- 1 star
5.88%
显示 3/34 个
MM
已于 Jul 14, 2025审阅
The instructor is amazing !!!! One of the best courses for excel forecasting, and data analysis techniques.
