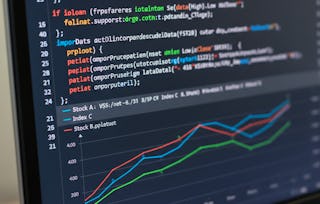
Coursera

Financial Data Analysis with Excel, Python and Power BI

Coursera

Financial Data Analysis with Excel, Python and Power BI

包含在 Coursera Plus

深入了解一个主题并学习基础知识。
中级 等级

推荐体验

1 周 完成
在 10 小时 一周
灵活的计划
自行安排学习进度
深入了解一个主题并学习基础知识。
中级 等级

推荐体验

1 周 完成
在 10 小时 一周
灵活的计划
自行安排学习进度

您将学到什么

  • Clean and transform financial datasets using Excel and Python

  • Build interactive Power BI dashboards with secure data models

  • Apply statistical summaries and data visualization for financial reporting

要了解的详细信息

可分享的证书

添加到您的领英档案

最近已更新!

March 2026

授课语言:英语(English)

了解顶级公司的员工如何掌握热门技能

Petrobras, TATA, Danone, Capgemini, P&G 和 L'Oreal 的徽标

积累 Data Analysis 领域的专业知识

本课程是 Financial Analyst: AI, Excel, and Power BI Skills 专业证书 专项课程的一部分
在注册此课程时,您还会同时注册此专业证书。
  • 向行业专家学习新概念
  • 获得对主题或工具的基础理解
  • 通过实践项目培养工作相关技能
  • 通过 Coursera 获得可共享的职业证书

该课程共有15个模块

You will recall the syntax for common spreadsheet functions and understand how they support accurate financial calculations. You’ll practice applying formulas correctly to ensure reliable budgeting and reporting.

涵盖的内容

3个视频1篇阅读材料2个作业

You will apply advanced spreadsheet functions to construct a financial budget template. You’ll automate summary values and compare actual results against targets to evaluate budget performance.

涵盖的内容

2个视频1篇阅读材料2个作业

You will recognize the core components within a business intelligence suite and understand how they connect to financial reporting workflows.

涵盖的内容

3个视频1篇阅读材料1个作业

You will apply data visualization tools to create and publish a chart from a dataset. You’ll refine visuals for clarity and share insights through Power BI Service.

涵盖的内容

2个视频1篇阅读材料2个作业

You will recognize the purpose of fundamental functions for data loading and initial inspection. You’ll explore dataset structure and identify potential quality issues before analysis.

涵盖的内容

3个视频1篇阅读材料1个作业

You will apply data cleaning techniques to a specified dataset using a computational notebook. You’ll standardize formats, resolve missing values, and prepare data for reliable analysis.

涵盖的内容

2个视频1篇阅读材料2个作业

You will recall commands to manage packages and inspect data frames. You’ll review data structure and confirm readiness for categorical analysis.

涵盖的内容

4个视频1篇阅读材料1个作业

You will apply frequency analysis to summarize the distribution of categorical data. You’ll interpret patterns and prepare results for reporting.

涵盖的内容

2个视频1篇阅读材料2个作业

You will recall the definitions and examples of structured, semi-structured, and unstructured data. You’ll understand how data structure affects financial reporting and governance.

涵盖的内容

3个视频1篇阅读材料2个作业

You will apply data import tools to transform semi-structured JSON into a tabular format. You’ll automate transformation workflows to support scalable reporting.

涵盖的内容

2个视频1篇阅读材料2个作业

You will create a star-schema data model by defining table relationships and calculated columns. You’ll structure financial datasets to support accurate and efficient reporting.

涵盖的内容

2个视频3篇阅读材料1个作业

You will apply row-level security rules to a published report. You’ll ensure sensitive financial information remains protected while supporting collaboration.

涵盖的内容

3个视频1篇阅读材料2个作业

You will apply Power Query to automate data cleansing and document the transformation logic. You’ll build repeatable workflows that reduce manual effort and improve reliability.

涵盖的内容

3个视频1篇阅读材料1个作业

You will apply advanced lookup formulas to create flexible data retrieval tools. You’ll design dynamic templates that retrieve financial data efficiently and accurately.

涵盖的内容

2个视频1篇阅读材料2个作业

In this project, you will clean and transform raw retail financial data and build a structured performance dashboard for executive review. You will standardize inconsistent data fields, convert semi-structured expense data into tabular format, and calculate key financial metrics including sales, cost of goods sold, and operating profit. Using the cleaned dataset, you will design a clear and professional dashboard that visualizes sales trends, expense breakdown, and store performance. You will also provide written insights explaining financial trends and the importance of data cleaning before analysis. This project simulates a real financial data transformation and reporting assignment commonly performed by entry-level financial and business analysts.

涵盖的内容

2篇阅读材料1个作业

获得职业证书

将此证书添加到您的 LinkedIn 个人资料、简历或履历中。在社交媒体和绩效考核中分享。

位教师

Professionals from the Industry
265 门课程 37,951 名学生

提供方

Coursera

从 Data Analysis 浏览更多内容

人们为什么选择 Coursera 来帮助自己实现职业发展

Felipe M.

自 2018开始学习的学生
''能够按照自己的速度和节奏学习课程是一次很棒的经历。只要符合自己的时间表和心情,我就可以学习。'

Jennifer J.

自 2020开始学习的学生
''我直接将从课程中学到的概念和技能应用到一个令人兴奋的新工作项目中。'

Larry W.

自 2021开始学习的学生
''如果我的大学不提供我需要的主题课程,Coursera 便是最好的去处之一。'

Chaitanya A.

''学习不仅仅是在工作中做的更好:它远不止于此。Coursera 让我无限制地学习。'
Coursera Plus

通过 Coursera Plus 开启新生涯

无限制访问 10,000+ 世界一流的课程、实践项目和就业就绪证书课程 - 所有这些都包含在您的订阅中

通过在线学位推动您的职业生涯

获取世界一流大学的学位 - 100% 在线

加入超过 3400 家选择 Coursera for Business 的全球公司

提升员工的技能,使其在数字经济中脱颖而出

常见问题

¹ 本课程的部分作业采用 AI 评分。对于这些作业,将根据 Coursera 隐私声明使用您的数据。