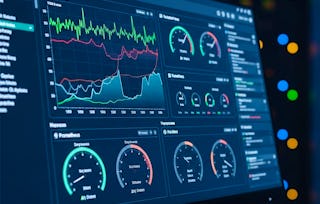
Modern software systems are complex, distributed, and always on which makes monitoring a critical skill for any engineer. This course equips developers, SREs, and IT professionals with the ability to build a complete monitoring stack using Prometheus and Grafana. Starting from the basics of exporters and metric collection, learners will gain hands-on experience installing and configuring Prometheus in a Linux environment. They will then master PromQL, the powerful query language that transforms raw time-series data into actionable insights. Moving beyond queries, the course introduces alerting rules and Alertmanager, enabling proactive detection of anomalies and faster incident response. Finally, learners will integrate Prometheus with Grafana to design intuitive dashboards that bring clarity to complex systems and support real-world troubleshooting.
只需 199 美元(原价 399 美元)即可通过 Coursera Plus 学习更高水平的技能。立即节省

您将学到什么
Configure Prometheus architecture to reliably collect, store, and query metrics in modern infrastructure environments.
Master PromQL to construct advanced queries that extract meaningful insights from time-series data.
Design effective alerting rules to proactively detect anomalies, ensure reliability, and reduce mean time to resolution (MTTR).
您将获得的技能
要了解的详细信息
了解顶级公司的员工如何掌握热门技能

该课程共有3个模块
This module introduces learners to monitoring systems, highlighting their importance in modern software development, and provides an overview of Prometheus architecture along with hands-on setup in a Linux environment.
涵盖的内容
4个视频2篇阅读材料1次同伴评审
This module builds on the foundations of Prometheus and exporters. Learners will dive into PromQL, the powerful query language of Prometheus, to turn raw metrics into actionable insights. They will also design and implement alerting rules that detect anomalies before they escalate.
涵盖的内容
3个视频1篇阅读材料1次同伴评审
In this module, learners will connect Prometheus to Grafana and create meaningful dashboards that transform raw metrics into actionable visualizations. They will explore how Grafana enhances observability, learn best practices for designing dashboards that support real-world troubleshooting, and gain confidence in presenting system health visually to both engineers and stakeholders.
涵盖的内容
4个视频1篇阅读材料1个作业2次同伴评审
提供方
人们为什么选择 Coursera 来帮助自己实现职业发展


常见问题
To access the course materials, assignments and to earn a Certificate, you will need to purchase the Certificate experience when you enroll in a course. You can try a Free Trial instead, or apply for Financial Aid. The course may offer 'Full Course, No Certificate' instead. This option lets you see all course materials, submit required assessments, and get a final grade. This also means that you will not be able to purchase a Certificate experience.
When you purchase a Certificate you get access to all course materials, including graded assignments. Upon completing the course, your electronic Certificate will be added to your Accomplishments page - from there, you can print your Certificate or add it to your LinkedIn profile.
Yes. In select learning programs, you can apply for financial aid or a scholarship if you can’t afford the enrollment fee. If fin aid or scholarship is available for your learning program selection, you’ll find a link to apply on the description page.
更多问题
提供助学金,
¹ 本课程的部分作业采用 AI 评分。对于这些作业,将根据 Coursera 隐私声明使用您的数据。