HM
5.0评论日期:Dec 16, 2023
Very Lively interaction from the mentor. Simplified explanations

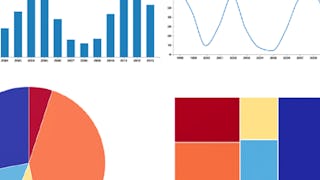
Data is everywhere. Charts, graphs, and other types of information visualizations help people to make sense of this data. This course explores the design, development, and evaluation of such information visualizations. By combining aspects of design, computer graphics, HCI, and data science, you will gain hands-on experience with creating visualizations, using exploratory tools, and architecting data narratives. Topics include user-centered design, web-based visualization, data cognition and perception, and design evaluation. This course can be taken for academic credit as part of CU Boulder’s MS in Data Science or MS in Computer Science degrees offered on the Coursera platform. These fully accredited graduate degrees offer targeted courses, short 8-week sessions, and pay-as-you-go tuition. Admission is based on performance in three preliminary courses, not academic history. CU degrees on Coursera are ideal for recent graduates or working professionals. Learn more: MS in Data Science: https://hua.dididi.sbs/degrees/master-of-science-data-science-boulder MS in Computer Science: https://coursera.org/degrees/ms-computer-science-boulder
HM
Very Lively interaction from the mentor. Simplified explanations
LB
Not your basic data visualization course - very in depth and interesting with concepts that are fresh and new. Professor is very thorough and understandable.
显示:8/8
The material is very dense with very limited exercise of the material.
Prof. Danielle nails all the steps of how to gather knowledge, develop and test your visualizations implementations and assumptions. It really opened my eyes on how to do data visualization in a scientific way.
Not your basic data visualization course - very in depth and interesting with concepts that are fresh and new. Professor is very thorough and understandable.
Very Lively interaction from the mentor. Simplified explanations
EXCELLENT COURSE , THANK YOU VERY MUCH
thanks alot , excellent course
nice
It was a good course, I wish there was a bigger focus on practice