Learners will be able to navigate the Minitab interface, apply essential statistical tools, and create meaningful data visualizations to support data-driven decision-making. By the end of this course, learners will confidently use Minitab’s menus, perform basic statistical analysis, explore predictive analytics features, and interpret graphical outputs such as probability distributions.
Apply Statistical Analysis Using Minitab for Beginners
您将学到什么
Navigate the Minitab interface and use menus to perform basic statistical analysis confidently.
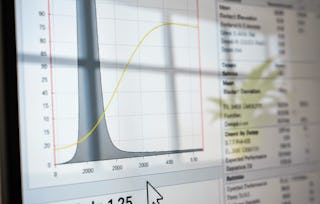
Create and interpret charts, graphs, and probability distributions using Minitab tools.
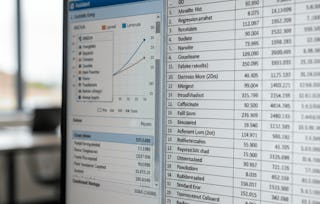
Apply Minitab features to analyze real datasets for data-driven decision making.
您将获得的技能
要了解的详细信息

可分享的证书
添加到您的领英档案
作业
6 项作业
授课语言:英语(English)
最近已更新!
February 2026
了解顶级公司的员工如何掌握热门技能

积累特定领域的专业知识
本课程是 Apply Statistical Data Analysis with Minitab 专项课程 专项课程的一部分
在注册此课程时,您还会同时注册此专项课程。
- 向行业专家学习新概念
- 获得对主题或工具的基础理解
- 通过实践项目培养工作相关技能
- 获得可共享的职业证书

该课程共有2个模块
This module introduces learners to the Minitab environment, course structure, and core interface components, enabling beginners to confidently navigate menus and understand how Minitab supports basic statistical and predictive analytics tasks.
涵盖的内容
4个视频3个作业
This module focuses on applying Minitab’s statistical menus and graphical assistants to analyze data, interpret results, and visualize distributions, helping learners transform raw data into meaningful insights.
涵盖的内容
4个视频3个作业
获得职业证书
将此证书添加到您的 LinkedIn 个人资料、简历或履历中。在社交媒体和绩效考核中分享。
人们为什么选择 Coursera 来帮助自己实现职业发展

Felipe M.
自 2018开始学习的学生
''能够按照自己的速度和节奏学习课程是一次很棒的经历。只要符合自己的时间表和心情,我就可以学习。'

Jennifer J.
自 2020开始学习的学生
''我直接将从课程中学到的概念和技能应用到一个令人兴奋的新工作项目中。'

Larry W.
自 2021开始学习的学生
''如果我的大学不提供我需要的主题课程,Coursera 便是最好的去处之一。'

Chaitanya A.
''学习不仅仅是在工作中做的更好:它远不止于此。Coursera 让我无限制地学习。'