Learners will be able to apply Python programming fundamentals, analyze real-world financial data, visualize market trends, and interpret key financial indicators using industry-relevant tools and techniques.
Apply Python for Practical Financial Data Analysis
您将学到什么
Apply Python fundamentals to analyze real-world financial datasets.
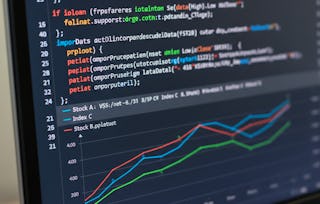
Visualize market trends using charts, indicators, and candlestick plots.
Interpret correlations and moving averages to support decisions.
您将获得的技能
您将学习的工具
要了解的详细信息

可分享的证书
添加到您的领英档案
作业
8 项作业
授课语言:英语(English)
最近已更新!
February 2026
了解顶级公司的员工如何掌握热门技能

人们为什么选择 Coursera 来帮助自己实现职业发展

Felipe M.
自 2018开始学习的学生
''能够按照自己的速度和节奏学习课程是一次很棒的经历。只要符合自己的时间表和心情,我就可以学习。'

Jennifer J.
自 2020开始学习的学生
''我直接将从课程中学到的概念和技能应用到一个令人兴奋的新工作项目中。'

Larry W.
自 2021开始学习的学生
''如果我的大学不提供我需要的主题课程,Coursera 便是最好的去处之一。'

Chaitanya A.
''学习不仅仅是在工作中做的更好:它远不止于此。Coursera 让我无限制地学习。'
从 Data Science 浏览更多内容

Corporate Finance Institute
The Hong Kong University of Science and Technology