Learners will be able to apply core Excel operations, construct formulas and functions, analyze datasets with PivotTables, and visualize results using charts while troubleshooting common errors. By completing this course, participants will build the confidence to manage data effectively, automate decision-making, and present insights professionally.

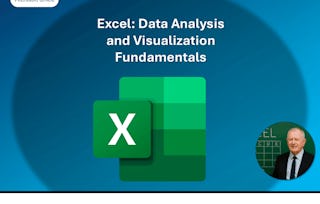
Master Microsoft Excel: Apply, Analyze & Visualize Data
本课程是多个项目的一部分。

位教师:EDUCBA
访问权限由 New York State Department of Labor 提供
8,078 人已注册
您将学到什么
Apply core Excel operations, formulas, and logical functions for data management.
Analyze datasets with PivotTables and troubleshoot errors effectively.
Visualize insights using charts and present data with professional formatting.
您将获得的技能
要了解的详细信息

添加到您的领英档案
14 项作业
September 2025
了解顶级公司的员工如何掌握热门技能

积累特定领域的专业知识
- 向行业专家学习新概念
- 获得对主题或工具的基础理解
- 通过实践项目培养工作相关技能
- 获得可共享的职业证书

该课程共有4个模块
This module introduces learners to the foundational aspects of Microsoft Excel, guiding them through the interface, startup screen, Ribbon, worksheets, cells, and file management essentials. By the end of this module, learners will be able to confidently navigate Excel’s workspace, understand its key features, and perform basic worksheet operations to build a strong foundation for advanced Excel skills.
涵盖的内容
6个视频3个作业
This module explores how to enhance the readability and professionalism of Excel workbooks through formatting techniques. Learners will discover how to apply basic formatting to cells, create reusable custom styles, and implement advanced number and data formatting to display values, dates, and times in flexible, user-friendly ways. By mastering these skills, learners will be able to present data clearly, maintain consistency across worksheets, and adapt Excel’s formatting features for real-world business scenarios.
涵盖的内容
5个视频3个作业
This module provides learners with the essential skills to perform calculations and apply logic within Microsoft Excel. Starting with mathematical operations and the BEDMAS rule, learners progress to building conditional logic using the IF function and then explore a wide range of essential functions such as COUNT, SUM, AVERAGE, MAX, MIN, and conditional variations like COUNTIF, AVERAGEIFS, and MINIFS. By mastering these tools, learners will be able to automate decision-making, analyze data accurately, and streamline complex calculations for business and personal use.
涵盖的内容
14个视频4个作业
This module equips learners with advanced Excel skills for managing, analyzing, and presenting data effectively. Learners will explore tools such as conditional formatting, tables, filtering, freezing panes, and printing layouts to organize large datasets. The module also covers PivotTables and chart types—including column, bar, line, pie, and map charts—for interactive analysis and clear visualization. Finally, learners will gain the ability to troubleshoot common Excel errors, ensuring accuracy and efficiency in professional reporting and data-driven decision-making.
涵盖的内容
17个视频4个作业
获得职业证书
将此证书添加到您的 LinkedIn 个人资料、简历或履历中。在社交媒体和绩效考核中分享。
人们为什么选择 Coursera 来帮助自己实现职业发展

Felipe M.

Jennifer J.

Larry W.

Chaitanya A.
学生评论
- 5 stars
73.33%
- 4 stars
25%
- 3 stars
1.66%
- 2 stars
0%
- 1 star
0%
显示 3/60 个
已于 Nov 13, 2025审阅
I finally understand how to use charts and PivotTables effectively.
已于 Dec 4, 2025审阅
Topics such as removing duplicates, using Flash Fill, applying filters, and handling messy datasets are covered in an easy-to-follow manner.
已于 Nov 20, 2025审阅
A great choice for anyone wanting to work more efficiently with data. The lessons on pivot tables were a highlight.


