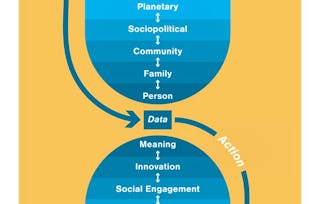
University of Minnesota
Introduction to Social Determinants of Health
University of Minnesota

Introduction to Social Determinants of Health

Daniel J. Pesut, Ph.D., RN, FAAN
Karen A. Monsen, PhD, RN, FAMIA, FNAP, FAAN

位教师:Daniel J. Pesut, Ph.D., RN, FAAN

包含在 Coursera Plus

深入了解一个主题并学习基础知识。
4.6

(14 条评论)

初级 等级
无需具备相关经验
2 周 完成
在 10 小时 一周
灵活的计划
自行安排学习进度
深入了解一个主题并学习基础知识。
4.6

(14 条评论)

初级 等级
无需具备相关经验
2 周 完成
在 10 小时 一周
灵活的计划
自行安排学习进度

要了解的详细信息

可分享的证书

添加到您的领英档案

授课语言:英语(English)

了解顶级公司的员工如何掌握热门技能

Petrobras, TATA, Danone, Capgemini, P&G 和 L'Oreal 的徽标

积累特定领域的专业知识

本课程是 Social Determinants of Health: Data to Action 专项课程 专项课程的一部分
在注册此课程时,您还会同时注册此专项课程。
  • 向行业专家学习新概念
  • 获得对主题或工具的基础理解
  • 通过实践项目培养工作相关技能
  • 获得可共享的职业证书

该课程共有5个模块

The purpose of this module is to provide an introduction to the social determinants of health in the context of this specialization. In lesson one, we will define the social determinants of health, explore how our understanding of social determinants has changed over time, and analyze the impact health inequity has on society. We will also consider the variety of transformational ideas that can be used to address health inequities. In lesson two, we will review different ways of knowing and how community knowledge can be augmented with data to influence policy. We will also evaluate defining characteristics of data, as we assess how data, analysis and partnership can be leveraged to create power for transformative change.

涵盖的内容

4个视频10篇阅读材料2个作业1个讨论话题8个插件

The purpose of this module is to provide a foundation of theoretical knowledge to support systems thinking and knowledge management principles applied to determinants of health. Systems thinking involves making distinctions, understanding systems, relationships, points of view and perspective taking. In lesson one, we will learn about the DSRP theory in regard to developing a systems thinking mindset. In lesson two, we introduce the Data to Action Hourglass model as a conceptual framework and a way to think about the different logical levels and relationships between and among determinants of health.

涵盖的内容

2个视频4篇阅读材料2个作业1个讨论话题3个插件

The purpose of this module is to introduce the concept of collective impact as a model and method for designing data driven collective impact initiatives. The principles and phases of collective impact are described and explained. Collective impact thinking requires a shift in mind that requires attention to systems thinking. Using a collective impact mindset supports and encourages collaboration and team science and the use of standardized data sets to understand and support knowledge work and translation with community and population data sets. Example case studies illustrate the power and potential of collective impact efforts to create transformational changes to support desired health care futures.

涵盖的内容

1个视频6篇阅读材料2个作业1个讨论话题1个插件

In this module we will define minority stress theory as it relates to the social determinants of health. In lesson one, we will define minority stress, and examine how systemic discrimination contributes to minority stress. We will also look at how minority stress can lead to health disparities. In lesson two, we will discuss the effects of structural inequalities on both advantage and disadvantaged groups. We will also explore the personal, interpersonal and social effects of minority stress. Finally, we will evaluate the personal and social resources available to counteract minority stress, as well as the ways in which data can be used to enact transformative changes.

涵盖的内容

2个视频2篇阅读材料2个作业1个讨论话题3个插件

This module will focus on analyzing, displaying and interpreting social determinants of health data, with a particular focus on identifying social determinants of health in large datasets. Lesson one will provide an overview of frequency analyses and bar chart visualizations. In lesson two, we will learn how to use the R environment in Coursera. Lesson three will introduce us to the datasets, NHANES and Omaha System, which we will use throughout the Data Application modules in this specialization. In lesson four, we will learn how to conduct frequency analyses and create bar charts in R. Using the NHANES dataset, we will obtain the frequencies of income, education, family savings, depression and insurance by race. Using the Omaha System dataset, we will obtain the frequencies of common social determinants by both race and ethnicity. Finally, we will discuss how to interpret the results of our analysis as we visualize our findings using bar plots.

涵盖的内容

4个视频6篇阅读材料1次同伴评审1个讨论话题1个非评分实验室4个插件

获得职业证书

将此证书添加到您的 LinkedIn 个人资料、简历或履历中。在社交媒体和绩效考核中分享。

位教师

授课教师评分
4.9 (8个评价)
Daniel J. Pesut, Ph.D., RN, FAAN
University of Minnesota
7 门课程7,349 名学生
Karen A. Monsen, PhD, RN, FAMIA, FNAP, FAAN
University of Minnesota
9 门课程48,547 名学生

提供方

从 Health Informatics 浏览更多内容

人们为什么选择 Coursera 来帮助自己实现职业发展

Felipe M.
自 2018开始学习的学生
''能够按照自己的速度和节奏学习课程是一次很棒的经历。只要符合自己的时间表和心情,我就可以学习。'
Jennifer J.
自 2020开始学习的学生
''我直接将从课程中学到的概念和技能应用到一个令人兴奋的新工作项目中。'
Larry W.
自 2021开始学习的学生
''如果我的大学不提供我需要的主题课程,Coursera 便是最好的去处之一。'
Chaitanya A.
''学习不仅仅是在工作中做的更好:它远不止于此。Coursera 让我无限制地学习。'
Coursera Plus

通过 Coursera Plus 开启新生涯

无限制访问 10,000+ 世界一流的课程、实践项目和就业就绪证书课程 - 所有这些都包含在您的订阅中

通过在线学位推动您的职业生涯

获取世界一流大学的学位 - 100% 在线

加入超过 3400 家选择 Coursera for Business 的全球公司

提升员工的技能,使其在数字经济中脱颖而出

常见问题

¹ 本课程的部分作业采用 AI 评分。对于这些作业,将根据 Coursera 隐私声明使用您的数据。