By the end of this course, learners will be able to identify the purpose of pivot tables, apply formatting for clarity, analyze data using sorting and filtering, evaluate datasets with grouping, interpret results through advanced field options, and automate workflows with macros.
Data Analysis with Pivot Tables: Build & Automate
通过 Coursera Plus 提高技能,仅需 239 美元/年(原价 399 美元)。立即节省
您将学到什么
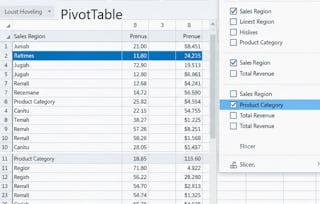
Build, format, and analyze datasets with pivot tables in Excel.
Apply grouping, sorting, filtering, and advanced field options.
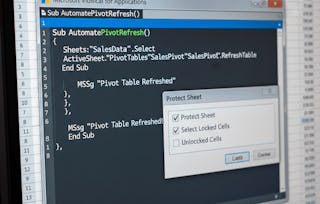
Automate workflows with macros and visualize data with charts.
您将获得的技能
您将学习的工具
要了解的详细信息

可分享的证书
添加到您的领英档案
最近已更新!
October 2025
作业
12 项作业
授课语言:英语(English)
了解顶级公司的员工如何掌握热门技能

积累特定领域的专业知识
本课程是 Microsoft Excel Mastery: From Basics to Pro Skills 专项课程 专项课程的一部分
在注册此课程时,您还会同时注册此专项课程。
- 向行业专家学习新概念
- 获得对主题或工具的基础理解
- 通过实践项目培养工作相关技能
- 获得可共享的职业证书

从 Business Essentials 浏览更多内容


人们为什么选择 Coursera 来帮助自己实现职业发展

Felipe M.
自 2018开始学习的学生
''能够按照自己的速度和节奏学习课程是一次很棒的经历。只要符合自己的时间表和心情,我就可以学习。'

Jennifer J.
自 2020开始学习的学生
''我直接将从课程中学到的概念和技能应用到一个令人兴奋的新工作项目中。'

Larry W.
自 2021开始学习的学生
''如果我的大学不提供我需要的主题课程,Coursera 便是最好的去处之一。'

Chaitanya A.
''学习不仅仅是在工作中做的更好:它远不止于此。Coursera 让我无限制地学习。'
学生评论
- 5 stars
96.66%
- 4 stars
3.33%
- 3 stars
0%
- 2 stars
0%
- 1 star
0%
显示 3/30 个
JP
已于 Feb 8, 2026审阅
Highly educational and engaging The instructor was clear and supportive, which made learning really enjoyable.
ND
已于 Jan 15, 2026审阅
Highly recommend this course, It’s informative, interactive, and well-designed. I finished it feeling inspired and confident to apply my new skills in real projects.
MP
已于 Jan 5, 2026审阅
Great course with actionable lessons! It’s clear a lot of thought went into the curriculum. This helped me improve quickly and effectively.
