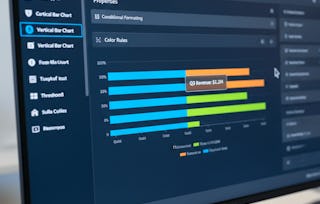
By completing this course, learners will be able to design clear, insight-driven dashboards that visualize project health and team performance, and evaluate dashboard feedback to improve clarity, usability, and decision-making impact. Learners will build confidence in selecting what information matters most, organizing it effectively, and refining dashboards based on real stakeholder needs.
Build Insight Dashboards is designed for IT management professionals who want to move beyond simply reporting data to enable better conversations and decisions. The course focuses on practical, job-relevant skills, using realistic scenarios that mirror how dashboards are used in meetings and day-to-day operations. You will practice assembling dashboards, interpreting ambiguous feedback, and making thoughtful tradeoffs between detail and clarity.

What makes this course unique is its emphasis on evaluation and design reasoning, not just tools or visuals. Rather than following rigid rules, learners develop judgment about why certain dashboards succeed while others fail. Through hands-on practice, guided reflection, and scenario-based assessments, you’ll gain skills you can immediately apply to improve the dashboards you support today—and continuously refine them as needed to evolve.
In this module, you will design a clear, actionable project health dashboard in Confluence using native reporting and visualization tools. The focus is on assembling the right components to surface delivery status, workload, and risks for stakeholders.
涵盖的内容
2个视频2篇阅读材料1个作业
显示有关单元内容的信息
2个视频•总计6分钟
Let’s Build Insightful Dashboards•2分钟
Connecting Jira Data to Confluence •4分钟
2篇阅读材料•总计11分钟
Core Confluence Dashboard Components •8分钟
Stepwise Walkthrough: Building a Live Support Operations Dashboard in Confluence•3分钟
1个作业•总计15分钟
Hands-On Learning: Build a Project Health Dashboard •15分钟
Improve Dashboards with Feedback
第 2 单元•小时 后完成
单元详情
In this module, you will evaluate dashboard usability using stakeholder feedback and improve clarity, layout, and chart selection to better support decision-making.
涵盖的内容
3个视频2篇阅读材料2个作业
显示有关单元内容的信息
3个视频•总计9分钟
Reading Dashboard Feedback Effectively •3分钟
Reworking Layouts and Visuals •3分钟
Congratulations and Continuous Learning Journey•2分钟
2篇阅读材料•总计10分钟
Visual Clarity and Chart Choices •7分钟
Stepwise Walkthrough: Improving a Support Dashboard Based on Stakeholder Feedback•3分钟
2个作业•总计35分钟
Graded Quiz: Build and Improve Insight Dashboards •20分钟
Hands-On Learning: Refine a Project Dashboard Using Stakeholder Feedback•15分钟
Coursera brings together a diverse network of subject matter experts who have demonstrated their expertise through professional industry experience or strong academic backgrounds. These instructors design and teach courses that make practical, career-relevant skills accessible to learners worldwide.
When will I have access to the lectures and assignments?
To access the course materials, assignments and to earn a Certificate, you will need to purchase the Certificate experience when you enroll in a course. You can try a Free Trial instead, or apply for Financial Aid. The course may offer 'Full Course, No Certificate' instead. This option lets you see all course materials, submit required assessments, and get a final grade. This also means that you will not be able to purchase a Certificate experience.
What will I get if I subscribe to this Specialization?
When you enroll in the course, you get access to all of the courses in the Specialization, and you earn a certificate when you complete the work. Your electronic Certificate will be added to your Accomplishments page - from there, you can print your Certificate or add it to your LinkedIn profile.
Is financial aid available?
Yes. In select learning programs, you can apply for financial aid or a scholarship if you can’t afford the enrollment fee. If fin aid or scholarship is available for your learning program selection, you’ll find a link to apply on the description page.