• 为个人
  • 为商务
  • 为大学
  • 为政府
学位
​
登录
免费加入
  • 浏览
  • Chart Js

个结果,搜索词为 "chart.js"


  • 状态:免费试用
    免费试用
    J

    Johns Hopkins University

    开始使用 R 进行数据可视化

    您将获得的技能: Rmarkdown, 散点图, 数据导入/导出, 统计可视化, 数据操作, 数据可视化软件, 柱状图, 数据可视化, 数据整理, Ggplot2, R 程序设计, Tidyverse(R 软件包), 统计报告

    4.7
    评分, 4.7 星,最高 5 星
    ·
    308 条评论

    初级 · 课程 · 1-4 周

  • 状态:新
    新
    状态:免费试用
    免费试用
    C

    Coursera

    Visualize and Chart Marketing Data Fast

    您将获得的技能: Performance Reporting, Marketing Analytics, Business Intelligence, Data Visualization Software, Dashboard, Data Presentation, Campaign Management, Power BI, Tableau Software, IBM Cognos Analytics, Grafana, Data Integration, Splunk

    初级 · 课程 · 1-4 周

  • 状态:免费试用
    免费试用
    M

    Microsoft

    JavaScript Data and Applications

    您将获得的技能: Performance Tuning, Software Testing, Unit Testing, Software Documentation, Application Programming Interface (API), Web Applications, Test Driven Development (TDD), Node.JS, Debugging, Maintainability, Javascript, Software Architecture, JSON, Real Time Data, Data Transformation

    初级 · 课程 · 1-4 周

  • P

    Packt

    Data Visualization in Stata

    您将获得的技能: Statistical Visualization, Data Visualization Software, Data Visualization, Scatter Plots, Plot (Graphics), Box Plots, Exploratory Data Analysis, Histogram, Descriptive Statistics, Heat Maps, Graphing

    中级 · 课程 · 1-3 个月

  • C

    Coursera

    Bootstrapping 的响应式设计:创建管理员 Dashboard

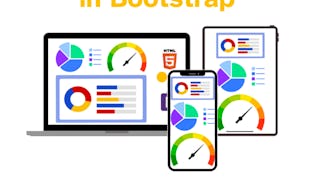
    您将获得的技能: 网络开发, HTML 和 CSS, Chart.js, 响应式网页设计, 数据可视化, 网页设计, 仪表板, 用户界面(UI), Bootstrap(前端框架), 用户界面组件, 网络应用

    中级 · 指导项目 · 不超过 2 小时

  • 状态:免费试用
    免费试用
    M

    Macquarie University

    Excel 中的数据可视化

    您将获得的技能: 数据分析, Excel 公式, 数据故事, 预测, 交互式数据可视化, Excel 宏, 信息图表, Microsoft Excel, 透视表和图表, 数据可视化软件, 数据可视化, 仪表板, 电子表格软件

    4.9
    评分, 4.9 星,最高 5 星
    ·
    1305 条评论

    中级 · 课程 · 1-3 个月

  • 状态:免费
    免费
    C

    Coursera

    Presenting Data Using Charts with Canva

    您将获得的技能: Presentations, Sales Presentations, Sales Presentation, Data Visualization, Productivity Software, Design

    4.4
    评分, 4.4 星,最高 5 星
    ·
    17 条评论

    初级 · 指导项目 · 不超过 2 小时

  • 状态:新
    新
    P

    Packt

    Python for Data Visualization - A Beginner's Guide

    您将获得的技能: Pandas (Python Package), Data Manipulation, Jupyter, NumPy, Regression Analysis

    初级 · 课程 · 1-3 个月

  • 状态:免费
    免费
    C

    Coursera

    Create an infographic with Infogram

    您将获得的技能: Data Storytelling, Infographics, Interactive Data Visualization, Data Visualization, Storytelling, Storyboarding, Diagram Design, Data Analysis, Graphic and Visual Design

    4.9
    评分, 4.9 星,最高 5 星
    ·
    9 条评论

    初级 · 指导项目 · 不超过 2 小时

  • 状态:免费
    免费
    C

    Coursera

    Create an Organizational Company Chart with Canva

    您将获得的技能: Marketing Design, Organizational Structure, Diagram Design, Marketing Collateral, Graphic Design, Presentations

    4.8
    评分, 4.8 星,最高 5 星
    ·
    12 条评论

    中级 · 指导项目 · 不超过 2 小时

  • C

    Coursera

    Introduction to D3.js

    您将获得的技能: Data Visualization Software, Data Visualization, Interactive Data Visualization, Visualization (Computer Graphics), JSON, Data Mapping, Javascript

    3.7
    评分, 3.7 星,最高 5 星
    ·
    7 条评论

    中级 · 指导项目 · 不超过 2 小时

  • 状态:免费
    免费
    C

    Coursera

    Data Visualization using Plotly

    您将获得的技能: Plotly, Exploratory Data Analysis, Scatter Plots, Plot (Graphics), Data Visualization, Data Visualization Software, Interactive Data Visualization, Python Programming

    4
    评分, 4 星,最高 5 星
    ·
    51 条评论

    中级 · 指导项目 · 不超过 2 小时

1…456…9

总之,以下是 10 最受欢迎的 chart.js 课程

  • 开始使用 R 进行数据可视化: Johns Hopkins University
  • Visualize and Chart Marketing Data Fast: Coursera
  • JavaScript Data and Applications: Microsoft
  • Data Visualization in Stata: Packt
  • Bootstrapping 的响应式设计:创建管理员 Dashboard: Coursera
  • Excel 中的数据可视化: Macquarie University
  • Presenting Data Using Charts with Canva: Coursera
  • Python for Data Visualization - A Beginner's Guide: Packt
  • Create an infographic with Infogram : Coursera
  • Create an Organizational Company Chart with Canva: Coursera

其他可浏览的主题

Arts and Humanities
338 课程
Business
1095 课程
Computer Science
668 课程
Data Science
425 课程
Information Technology
145 课程
Health
471 课程
Math and Logic
70 课程
Personal Development
137 课程
Physical Science and Engineering
413 课程
Social Sciences
401 课程
Language Learning
150 课程

Coursera 页脚

技能

  • 会计
  • 人工智能(AI)
  • 网络安全
  • 数据分析
  • 数字营销
  • 人力资源(HR)
  • Microsoft Excel
  • 项目管理
  • Python
  • 查询语言

专业证书

  • Google 人工智能证书
  • Google 网络安全证书
  • Google 数据分析证书
  • Google IT 支持证书
  • Google 项目管理证书
  • Google 用户体验设计证书
  • IBM 人工智能工程证书
  • IBM 人工智能产品经理证书
  • IBM 数据科学证书
  • Intuit 学院簿记证书

课程与专项课程

  • 人工智能基础专项课程
  • 商业人工智能专项课程
  • 面向所有人的人工智能课程
  • 医疗保健领域的人工智能专项课程
  • 深度学习专项课程
  • 商务专项课程 Excel 技能
  • 金融市场课程
  • 机器学习专项课程
  • 聊天 GPT 课程的即时工程
  • Python for Everybody 专项课程

职业资源

  • 职业能力倾向测验
  • CAPM 认证要求
  • CompTIA A+ 认证要求
  • CompTIA Security+ 认证要求
  • 基本 IT 认证
  • 免费 IT 认证和课程
  • 学习高收入技能
  • 如何学习人工智能
  • PMP 认证要求
  • 热门网络安全认证

Coursera

  • 关于
  • 我们提供的内容
  • 管理团队
  • 工作机会
  • 目录
  • Coursera Plus
  • 专业证书
  • MasterTrack® 证书
  • 学位
  • 企业版
  • 政府版
  • 面向校园
  • 成为合作伙伴
  • 社会影响
  • 免费课程
  • 分享您的 Coursera 学习故事

社区

  • 学生
  • 合作伙伴
  • Beta 测试人员
  • 博客
  • Coursera 播客
  • 技术博客

更多

  • 媒体
  • 投资者
  • 条款
  • 隐私
  • 帮助
  • 内容访问
  • 联系我们
  • 文章
  • 目录
  • 附属公司
  • 现代奴隶制声明
  • 请勿出售/共享
随时随地学习
通过 App Store 下载
通过 Google Play 获取
B 型企业认证标志
© 2026 Coursera Inc.保留所有权利。
  • Coursera Facebook
  • Coursera Linkedin
  • Coursera Twitter
  • Coursera YouTube
  • Coursera Instagram
  • Coursera TikTok